How to create a choropleth map with GeoJSON and Google Maps
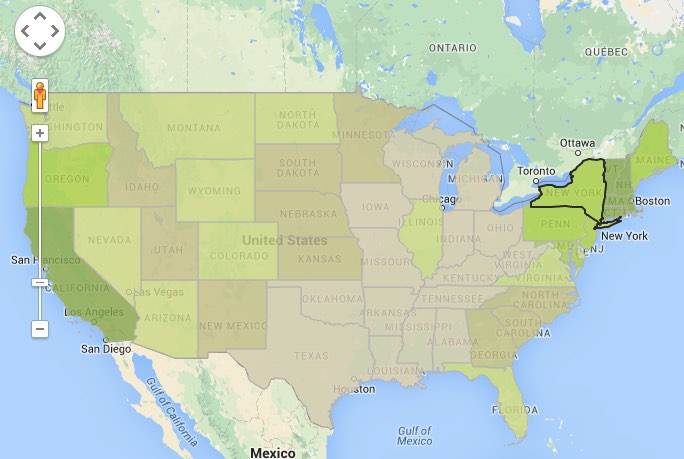
- 6 minsChoropleth maps are straight up awesome at displaying statistical information for a given area. To paraphrase wikipedia, they are thematic maps which have areas shaded or patterned in proportion to a statistical value for that area. We will walk through Google Maps and GeoJSON to create and display a choropleth map like this one.
GeoJSON
The GeoJSON file will use the geometry guidelines for each given area displayed. Plus, the file should have the statistical info you are going to represent in the properties field of each area. For example, I am using a GeoJSON file that has all the US states and I have added the property of COLI (Cost of Living Index) to each state. The object for Arizona in the array of state objects that I am using looks like this:
{
"type":"Feature",
"properties":{"GEO_ID":"0400000US04","STATE":"04","NAME":"Arizona","LSAD":"","CENSUSAREA":113594.084,"ABVR":"AZ","COLI":103.94696969696945},
"geometry":{"type":"Polygon","coordinates":['multi-dimensional array of latitude and longitude properties']}
}
Setting up Google Maps
First, make sure to add the Google Map api script with all your other scripts in your index html file. Now you will need to create a div on the html view you want to display the map and give that div an id (I typically give it an id of map-canvas). You will want to give this div a height and width value in your css file. Next, you will want to setup the map options. Google Maps has bunch of map options so please read their documentation to configure the map to your liking. Finally, you will set the map by calling the Map function with the google maps api and pass in the ID of the html element and the map options.
// here is what I used for map options
var mapOptions = {
  zoom: 4,
  scrollwheel: false,
  center: new google.maps.LatLng(40.00, -98),
  mapTypeId: google.maps.MapTypeId.ROADMAP,
  mapTypeControl: false,
  mapTypeControlOptions: {
    mapTypeIds: [google.maps.MapTypeId.ROADMAP, google.maps.MapTypeId.TERRAIN]
  }
}

var map = new google.maps.Map(document.getElementById('map-canvas'), mapOptions);
Adding the GeoJSON Data Layer
After Google Maps is beautifully displaying on your html, you will want to add the GeoJSON data layer to get the choropleth map. First, create a variable that will hold the data and call the google maps Data function. Next, you will call the function loadGeoJson on that variable that was just created. After that you will want to the set the map with the variable of the layer that has your GeoJSON data. Note that the final step of setting the data layer by calling setMap will need after any styling you want to add which will be described in the next section.
// Create the state data layer and load the GeoJson Data
var stateLayer = new google.maps.Data();
stateLayer.loadGeoJson('URL to GeoJSON file');

// Final step here sets the stateLayer GeoJSON data onto the map
stateLayer.setMap(map)
Styling the GeoJSON Data Layer
Now we will want to style or GeoJSON to show the awesomeness of the choropleth map. First we are going to call the setStyle function on the data layer variable. In this function we will return the styling, for the fillColor property we will call another function that we create (lets call this getColor) that will return a color to style that area based on the value of the property.
// Create the state data layer and load the GeoJson Data
var stateLayer = new google.maps.Data();
stateLayer.loadGeoJson('URL to GeoJSON file');

// Set and apply styling to the stateLayer
stateLayer.setStyle(function(feature) {
  return {
    fillColor: getColor(feature.getProperty('COLI')), // call function to get color for state based on the COLI (Cost of Living Index)
    fillOpacity: 0.8,
    strokeColor: '#b3b3b3',
    strokeWeight: 1,
    zIndex: 1
  };
});

// Final step here sets the stateLayer GeoJSON data onto the map
stateLayer.setMap(map)

// returns a color based on the value given when the function is called
function getColor(coli) {

  return coli >= 121 ? '#89a844' :
    coli > 110 ? '#acd033' :
    coli > 102.5 ? '#cbd97c' :
    coli > 100 ? '#c2c083' :
    '#d1ccad';
}
Adding Listeners for More Styling
Google Maps has cool functionality that allows us to add listeners to each property of our GeoJSON file. We can add mouseover, mouseout, click, and more. Here is an example.
// Add mouseover and mouse out styling for the GeoJSON State data
stateLayer.addListener('mouseover', function(e) {
  stateLayer.overrideStyle(e.feature, {
    strokeColor: '#2a2a2a',
    strokeWeight: 2,
    zIndex: 2
  });
});

stateLayer.addListener('mouseout', function(e) {
  stateLayer.revertStyle();
});
Conclusion
Now you should have a choropleth styled Google Map in your html. The plunker I created to show this example is below. Note, I used Angular for the plunker example, but please feel free to use straight JavaScript or whatever JS framework you want.

Daniel Margol
Software Engineer at Indigov.